Many strange phenomena have been documented during total solar eclipses, such as increased plant activity and strange behaviors in animals, but does anything happen to sap flow? Certainly we can guess what would happen, but to see this effect in reality is nearly impossible for many reasons. Obviously the first major problem in documenting this is that total solar eclipses are very rare, occurring about once every 18 months somewhere on earth. The next issue is that it needs to occur in a specific region of the world where there are an abundance of maple trees. The odds of a total solar eclipse occurring in a specific location is about once in every 330 years. The third major hurdle is that the eclipse must occur during sugaring season when the sap is running! This combination seems impossible, but it wasn’t on April 8, 2024 when a total solar eclipse passed through northern Vermont near the Canadian border, mid-afternoon, on one of the final runs of the season. Of course How’s it running was there recording exactly what happens…
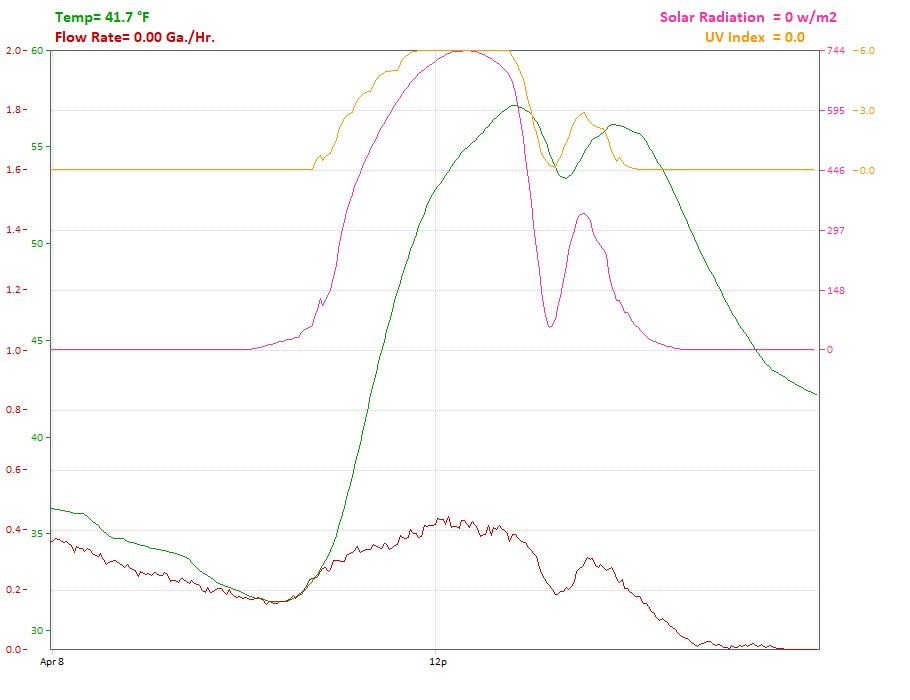
Looking at Figure 1, the dark brown curve shows the flow rate of sap over the entire day of April 8. As you can see, sap was running of April 7 and slowed down overnight, but since it didn’t freeze it didn’t stop running. Once the sun rose and things started warming up the flow increased gradually. The solar eclipse reached totality around 2pm and you can clearly see the impact on temperature [the green curve]. The eclipse begins around 1pm where you can see the temperature begin to fall, bottoming out a peak and then increasing again as the eclipse ends. The total temperature drop was about 5 degrees, which doesn’t seem like much, but if you were there you would think it got much colder, more on this later. Looking back to the sap flow, you can see that for one tap in a tree, the peak flow rate was about 0.4 gallons of sap per hour, not great, but very good. At the peak of the eclipse, this flow rate was essentially cut in half, which is very substantial. If you look around 9am, you can see the temperature is around 32F and flow rate is about 0.2 gallons per hour. This amount doubles [similar to what happens during the eclipse] before noon, when the temperature changed about 20 degrees, not the 5 degrees during the eclipse. Are there other things going on? Let’s take a look at figure 2…
Figure 2 shows the same temperature and sap flow data from figure 1, but now we overlay Solar Radiation data [pink curve] and UV Index [yellow curve]. Many of us have heard about UV Index from our weather forecast, warning us to where sunscreen as it approaches 10. Here you can see it peaked at 6 and was zero at night and during totality. The more interesting data is Solar Radiation which is the energy produced by the sun. It should be clear that this would be zero overnight, and the peak value of 744 in this case isn’t important, but indicates a very sunny day given the time of the year and our location. You can see a sharp drop during the eclipse, much sharper than the increase in the morning. So I would say this has the largest impact on the sap flow during an eclipse. This is also why it felt so much colder during the eclipse. What do you think?