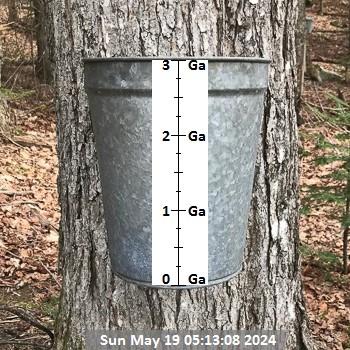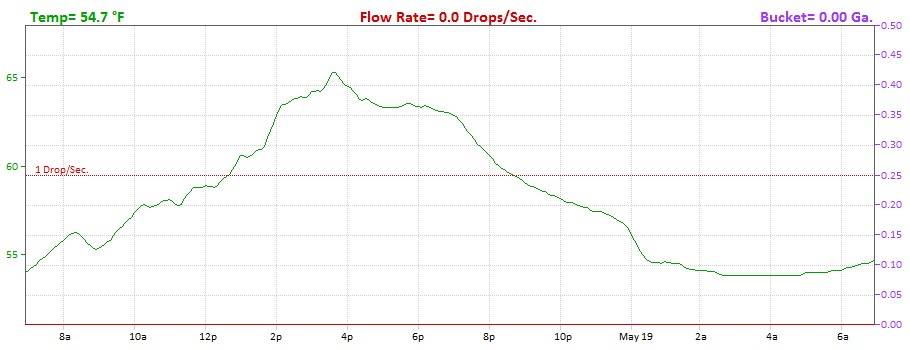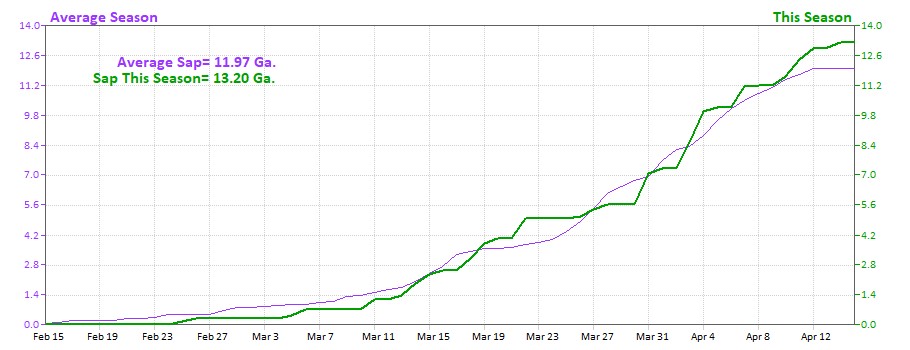
These real-time images show the flow rate of the sap at the tree as it varies throughout the season. In general, the flow rate of sap in a traditional style tap reaches a maximum of 2-drops per second and, of course, can fluctuate down to zero depending on the weather. This relationship between flow rate and weather can be seen in the graphs on the “Weather” pages on this site and in the graph at the bottom of this page. The animation to the left shows the sap flow rate at the bucket. The bucket on the right shows how much sap is currently in the bucket [the white region indicates the empty part of the bucket]. The bucket also fills up in real-time depending on the flow rate, so check back often to see how things are going. Once the sap is gathered, the bucket will be emptied, and the run will continue…and of course, lets hope the bucket is never full, or we are losing sap. During the off-season, these images may be updated randomly.